
In this post, we will talk about how to create and, most importantly, automate a business reporting dashboard. We will talk about the process of creating the dashboard and sourcing & updating the data behind it.
You saw these fancy dashboards big companies have. Lot`s of data, from sales to orders, to geographies, broken down by product, YoY comparisons, etc. From the first glance, they look very complex and very expensive – a lot of times they really are. In reality, it is not a rocket science, and with the right data system, even a small business can build & maintain a similar dashboard for as little as $500/month (hit the “Schedule Consultation” button on our home page *wink wink*).
Let`s go from the target outcome (dashboard) to what`s behind it (business data system).
There are a few very popular tools for creating and maintaining a dashboard. The most popular ones – PowerBI and Tableau. Personally, I prefer PowerBI because Microsoft has done a great job integrating it into the entire office ecosystem, enabling workflows otherwise not possible. For example, accessing dashboard`s data model directly in Excel via Pivot Table, making finance, accounting, marketing, and operations teams super happy.
1. PowerBI dashboard has graphs and summary values displaying key information.
The example graph shows one of dashboard charts – team`s compliance to company`s procedures. It displays a number of submitted opening and closing checklists through Jotform for a retail facility. A regional manager can monitor this data across multiple facilities and evaluate how local business units are adhering to operational standards, and how this consistency in operations affects the quality and levels of business performance.
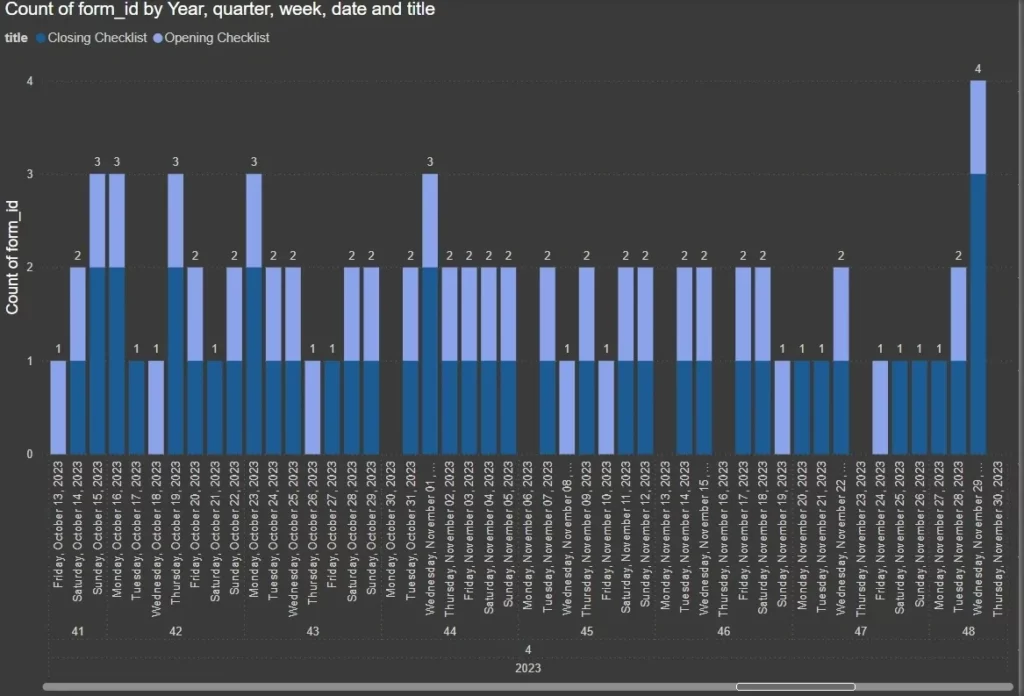
The graph looks rather simple but wait till you get to what`s behind it.
2. The dashboard is displaying numbers from the data model. It is a key component that connects all different data tables together and allows slicing and dicing data across different filters and dimensions.
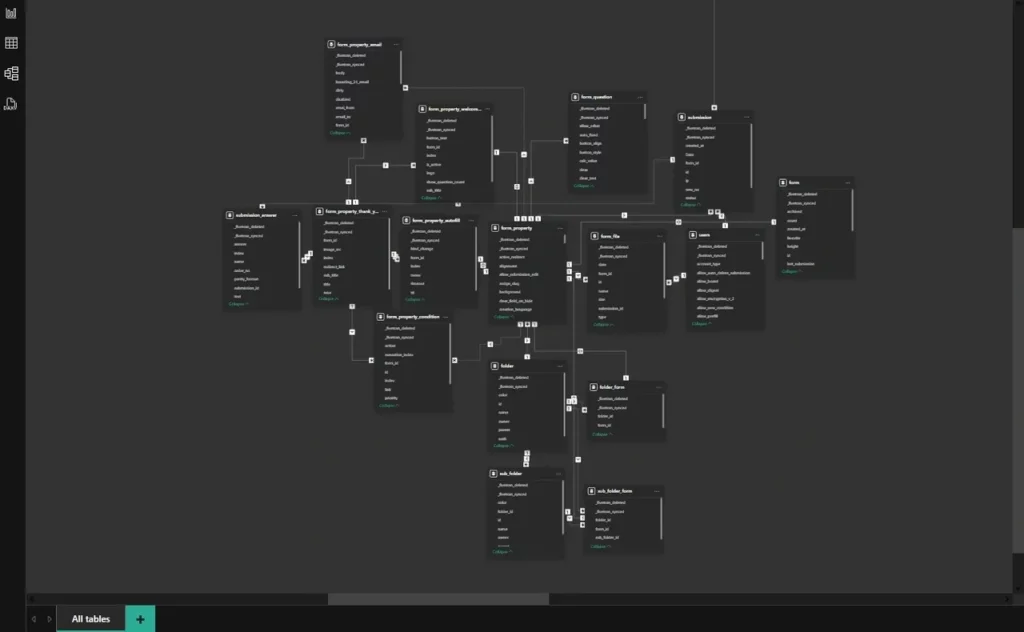
Your first reaction might be “What the hell is this sorcery”. At least, this was mine a long time ago when I first started.
Each individual block is an individual data table. When they are connected together, filters in one block affect outputs in another one, and so on. Data models can get very complex. Good news is, with the right data system setup, you only have to do it once!
3. Data model consists of individual data tables – often (and ideally) pulled from the data warehouse. It is a centralized place where data from different business tools is stored. The example shows you a data warehouse setup for a test company.
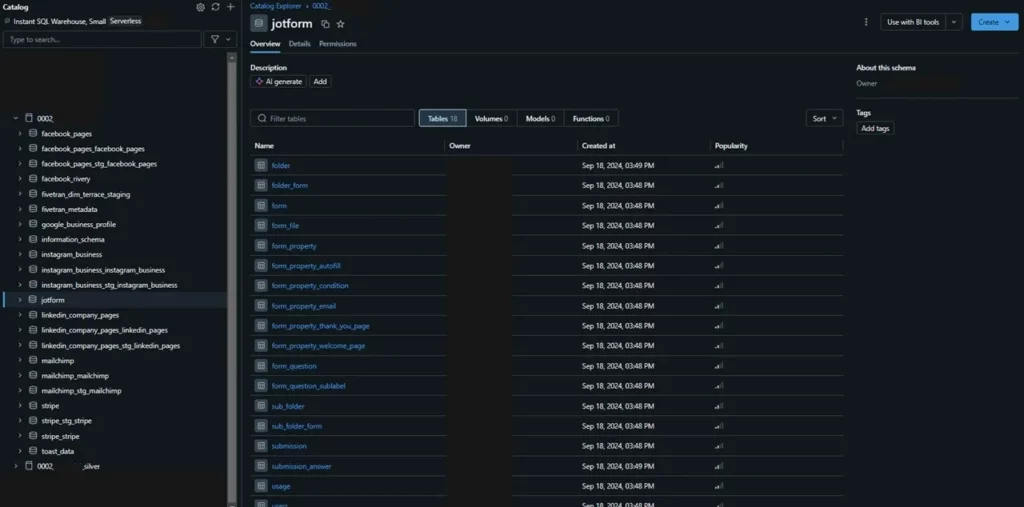
As you see, data from Jotform consists of 18 tables, each has a lot of rows and columns. This company also pulls data from Facebook, Google Business Profile, Instagram, LinkedIn, Mailchimp, Stripe, and Toast.
So, how do you get this data to the warehouse and keep it up to date?
4. Data is automatically loaded to the warehouse every day in multiple ways. Some data is uploaded by 3rd party connectors, and some via custom Python scripts running on a schedule in the cloud.
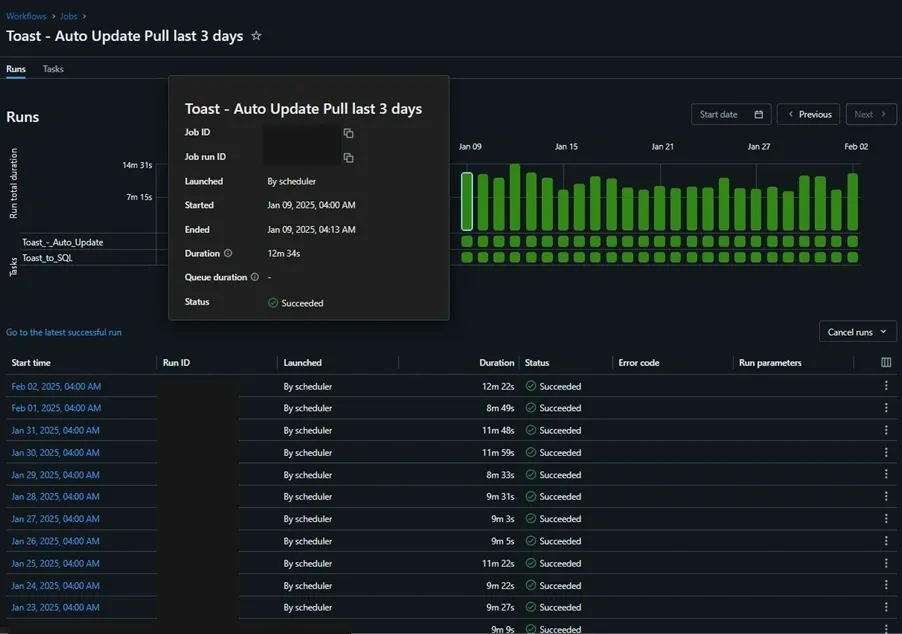
This is an example of a custom Python script that every day at 4:00 am connects to Toast`s back-end, extracts all available data for the past few days, and loads new entries to the data warehouse via SQL.
Obviously, the more data sources there are, the more computational power we need, and data models become more complex.
That`s Pretty Much It!
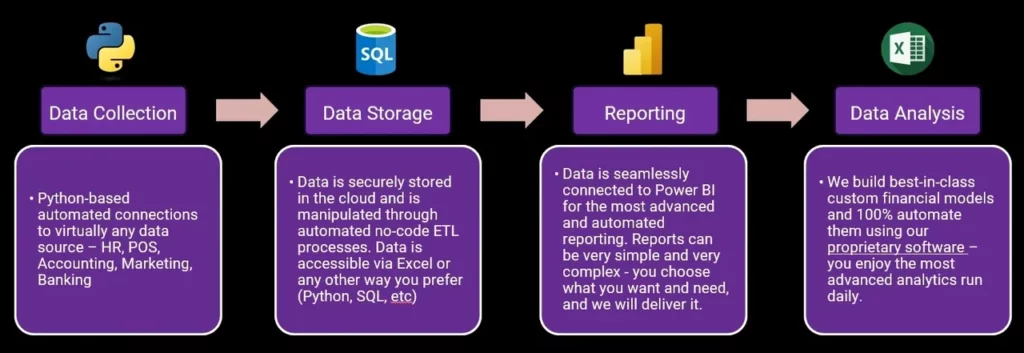
This is a very basic setup and data flow, and it does the job very well. Now, let`s say a business has multiple retail locations, then, you will be pulling the data above for each retail location. This is where an additional key step is added – ETL. It stands for Extract, Transform, Load, and, in this example, it would take data from individual locations, and aggregate it together. This will ensure that in PowerBI we can show aggregated, as well as per-location data in the reports.
The data system and related infrastructure is key to successful business intelligence support. Example above showed just one application of the system – Reporting. Another important component is Analysis. We will go through the second component in more details in other posts. But the business data system explained above supports the step perfectly.
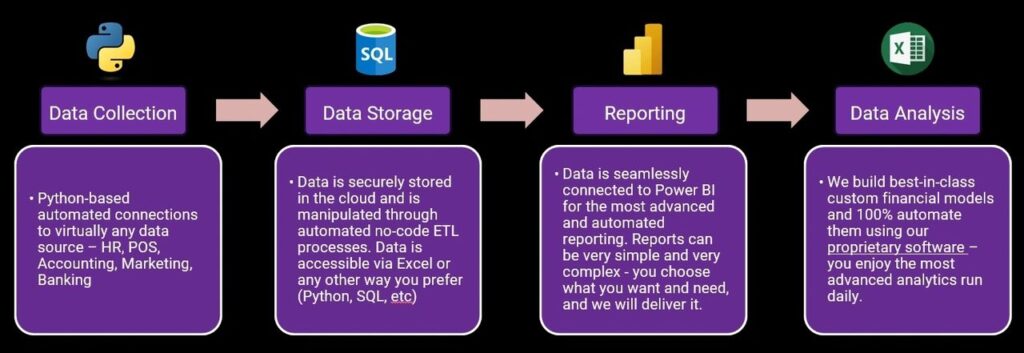
In summary, this is what the entire process looks like:
What`s Next?
1. If you are very familiar with building PowerBI dashboards, creating data models, creating workflows with Python scripts pulling the data, and so on, ROI Chief`s self-managed plan will be perfect for you. The entire infrastructure will be set up and hosted in the cloud for you. Moreover, we will help and direct you regarding connecting data sources to the warehouse.
2. If you want robust data reporting & analytics, ROI Chief`s managed plan will take care of everything for you.
Reach out to us via the contact form on the bottom of any page if you are interested or have any questions.