
The main objective of every business is to make profit. Lot`s of steps to achieve it – from improving your revenue to optimizing COGS, to managing your labor and administrative costs. In the world of fierce business competition, the strongest survive. Means your operations must be efficient, lean, cheap, reliable, and your decisions must yield positive return on the investment, tactically and strategically. How do you achieve that?
Any fancy MBA will always say the same thing – “let`s look at the data to make informed value-driven decisions“. Yeah, yeah, heard that so many times. Very often, “business data” is used as a very generalized concept. What does it even mean? What data do you have? Where do you get it? How do you look at it? How do you analyze it? Do I need to have dozens of excel spreadsheets copy-pasting data into them every week?
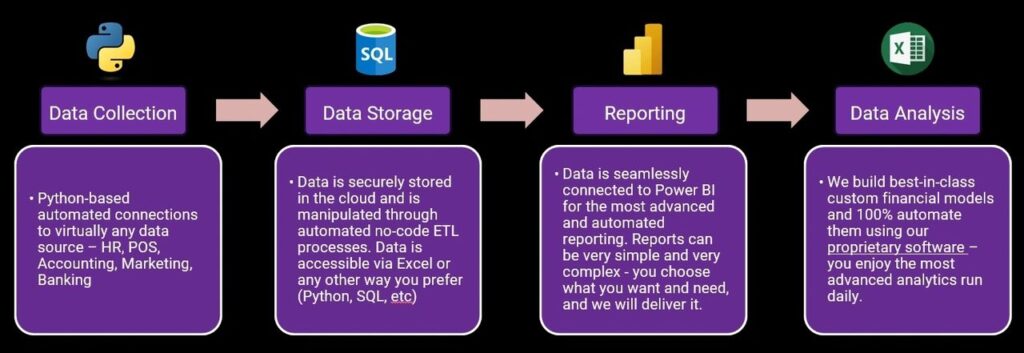
Just like any business has an accounting system, any business must have a data system. The chart below summarizes key elements and steps in the process with examples of tools used to achieve it.
1. Data Warehouse (Data Storage)
In order to utilize the data efficiently, you must own it. The most common way of owning your data is to have it in your Data Warehouse. This is one of the most fundamental and important steps in the system. This is where you store all your business data – data from your POS (orders, invoices, payments, customers), data from your accounting (GL transactions, statements), data from your marketing channels (Instagram ad campaigns impressions & clicks, Google Analytics website visits), and so on.
In very simple terms – data warehouse is a storage unit that stores all the data and lets you upload and download it as needed. Technically speaking, your revenue spreadsheet where you copy-paste data from your POS monthly is a data warehouse! Obviously, there are a lot of ways this can be improved.
For effective business operations, data warehouse has to have certain features. It has to be Secure, have Versatile Access, be Available Anywhere and Anytime, support Automations, be Cheap, and be Scalable. For me personally, it also has to have the ability to easily ingest data, have uniform storage scheme, being able to connect seamlessly to reporting tools such as PowerBI, being able to access the data directly in Excel, and have a very common technology behind it, like abilities to manipulate data via Python or SQL.
2. Data Collection
Great, you have an awesome data warehouse, how do you upload data to it? Moreover, the process must be automated as much as possible.
Generally, there are 3 ways of collecting data and uploading it to the warehouse:
- Using 3rd party software & connections to automatically push and sync data to your warehouse. You don’t even have to do anything! For business, it is a win-win, you don`t spend any time copy-pasting data or coding a script that will do it for you. You save a lot of time, and time is $$$. Typically, it comes at a relatively small cost of $5-50 per month per data source, mostly depending on the volumes processed. Most modern platforms have this functionality readily available – it is very easy to sync data from Stripe, Quickbooks, Slack, ADP, and other popular technology-driven tools using a service like Fivetran.
- Building custom Python script to extract and load data to your warehouse. This can be done with any tool that has API. For businesses, it is a good rule of thumb – “If a tool has API, it is a good tool!”. It`ll take some time (~ a few hours to a few days) to build a script that makes API calls, extracts data, and syncs it to the warehouse. And here you run into a problem. You have a script that does the job, but how do you make it run every day or even every hour? You have to have a computer that runs 24/7, has a reliable connection, that can do it non-stop. One of my favorite tools for this is Databricks. Databricks platform allows to host Python scripts in the cloud, launching them on a schedule and, the best part, utilize compute resources only when you need them. And you only pay for the compute resource when you use it! Monthly cost of this can be as low as a few $ per month per script that runs daily.
- Building custom Scrapers. This is the most challenging and most costly method. You only have to do it if there is no other choice – extreme cases, but they happen. It will be a more complex script that simulates user actions on the web to pull data and then upload it to the warehouse.
All these 3 methods give us assurance that 99% of all business data can be automated for regular upload to the warehouse.
3. Reporting
A lot of times, data in the warehouse represents hundreds of tables – all interconnected through different data relationships. When you have it all in one place, you need to make sense of it. Creating business intelligence dashboards in tools like PowerBI is a great way to start getting insights about the data you have. The key step here is to seamlessly connect PowerBI to your data warehouse. And as your data is updated in the warehouse, it will also be updated in PowerBI. This is a crucial component in automating the reporting. At this stage, you can make basic reports as well as start adding more advance analytics – YoY comparisons, % of totals, calculate ratios, etc.
4. Data Analysis
For accountants, CFOs, financial analysts, and many other roles, Excel is still the king due to its versatility, speed, and ease of data analysis. The final step in the process is the ability to seamlessly load and update the data in Excel. Thanks to Microsoft`s advancements in their ecosystem, you can seamlessly load Data Models from PowerBI directly to Excel. That means you can very easily load the most recent data in your spreadsheet, and start slicing and dicing with Pivot table across different datasets and dimensions, speeding up your analysis and completely removing the step of obtaining and cleaning the data needed for the analysis. Moreover, carefully designed financial model can automate the process – all you need is to refresh the data, and you are good to go!
At ROI Chief, we take this step especially serious. Not only we craft best-in-class financial models, we make them fully dynamic, responsive to changes, and fully automated through our proprietary software. Once the analysis is done, we load data back into the warehouse and produce reports in PowerBI. Examples are programs tracking performance by business units, forecasts, budget performance, headcount management, marketing program analytics, 3-statement modeling, company valuation, and so much more.
Data management is an essential component of modern businesses. With this system in place, it is easy to brag to the fanciest MBAs out there that you are data- and technology- driven business. Your potential investors and existing shareholders would love that too. Moreover, this process future-proofs your business operations for the era of AI. A little bit more on that later.
At ROI Chief, we make it easy for you. No need to outsource IT department, no need to bring part-time CFO or extra accountant. You do your business as usual, and we take care of the rest, saving you $$$, resources, and stress, all while providing you with the best-in-class data analytics for business. Reach out today for a free consultation.
